The Ice Tilt metric, derived from NHL EDGE IQ powered by AWS, is valuable because it always provides insights into game flow. Understanding the specific story it tells often requires additional context, and the ongoing Western Conference Final between the Edmonton Oilers and the Dallas Stars perfectly illustrates this. By analyzing various factors, Ice Tilt can show which team is truly dominating play on the ice at any given time.
To briefly explain the metric: Ice Tilt calculates the average position of all 12 skaters on the ice over two-minute intervals to provide a smoother representation of territorial advantage. A common observation is that teams behind on the scoreboard in the third period often register a higher total Ice Tilt for the game, primarily because they dictate play in that final period. This phenomenon, known as “score effects,” is why analysis often focuses on Ice Tilt data from only the first two periods.
Experienced hockey fans easily accept that the score influences where the game is played in the third period. It`s widely understood that teams with a lead avoid risky offensive plays that could create counter-attack chances, often playing more cautiously in marginal situations. Coupled with the increased urgency of teams trying to catch up (and coaches using their top offensive talent more), teams that are losing frequently spend more time in the opponent`s end during the third period.
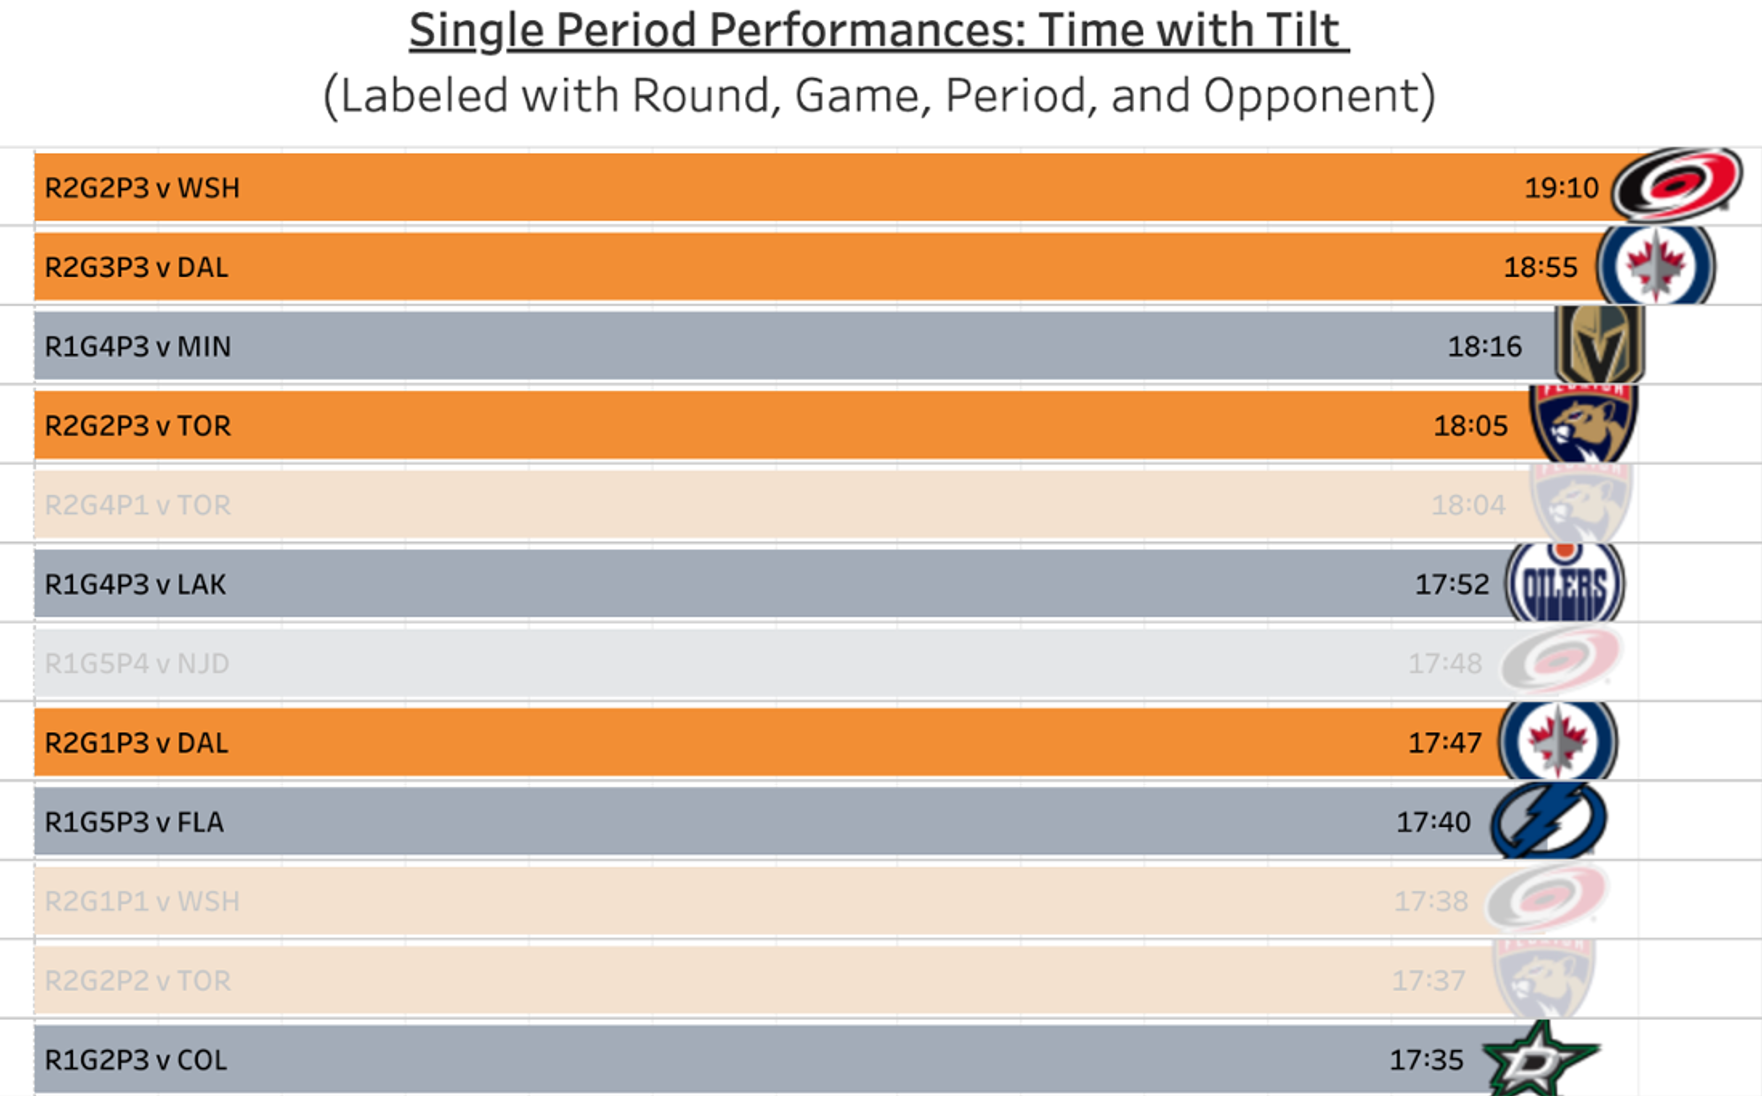
Consequently, when examining which period shows the highest Ice Tilt for a team, the third period typically stands out. The accompanying chart visually confirms this, showing that third periods consistently have the highest Ice Tilt values throughout the playoffs.
Now let`s apply this to the Stars-Oilers series. The next chart shows that in Games 1 through 3, the team that was behind on the scoreboard (represented by the red bar segment) dominated the Ice Tilt in the third period. Dallas secured the win in Game 1, while Edmonton won Games 2 and 3.
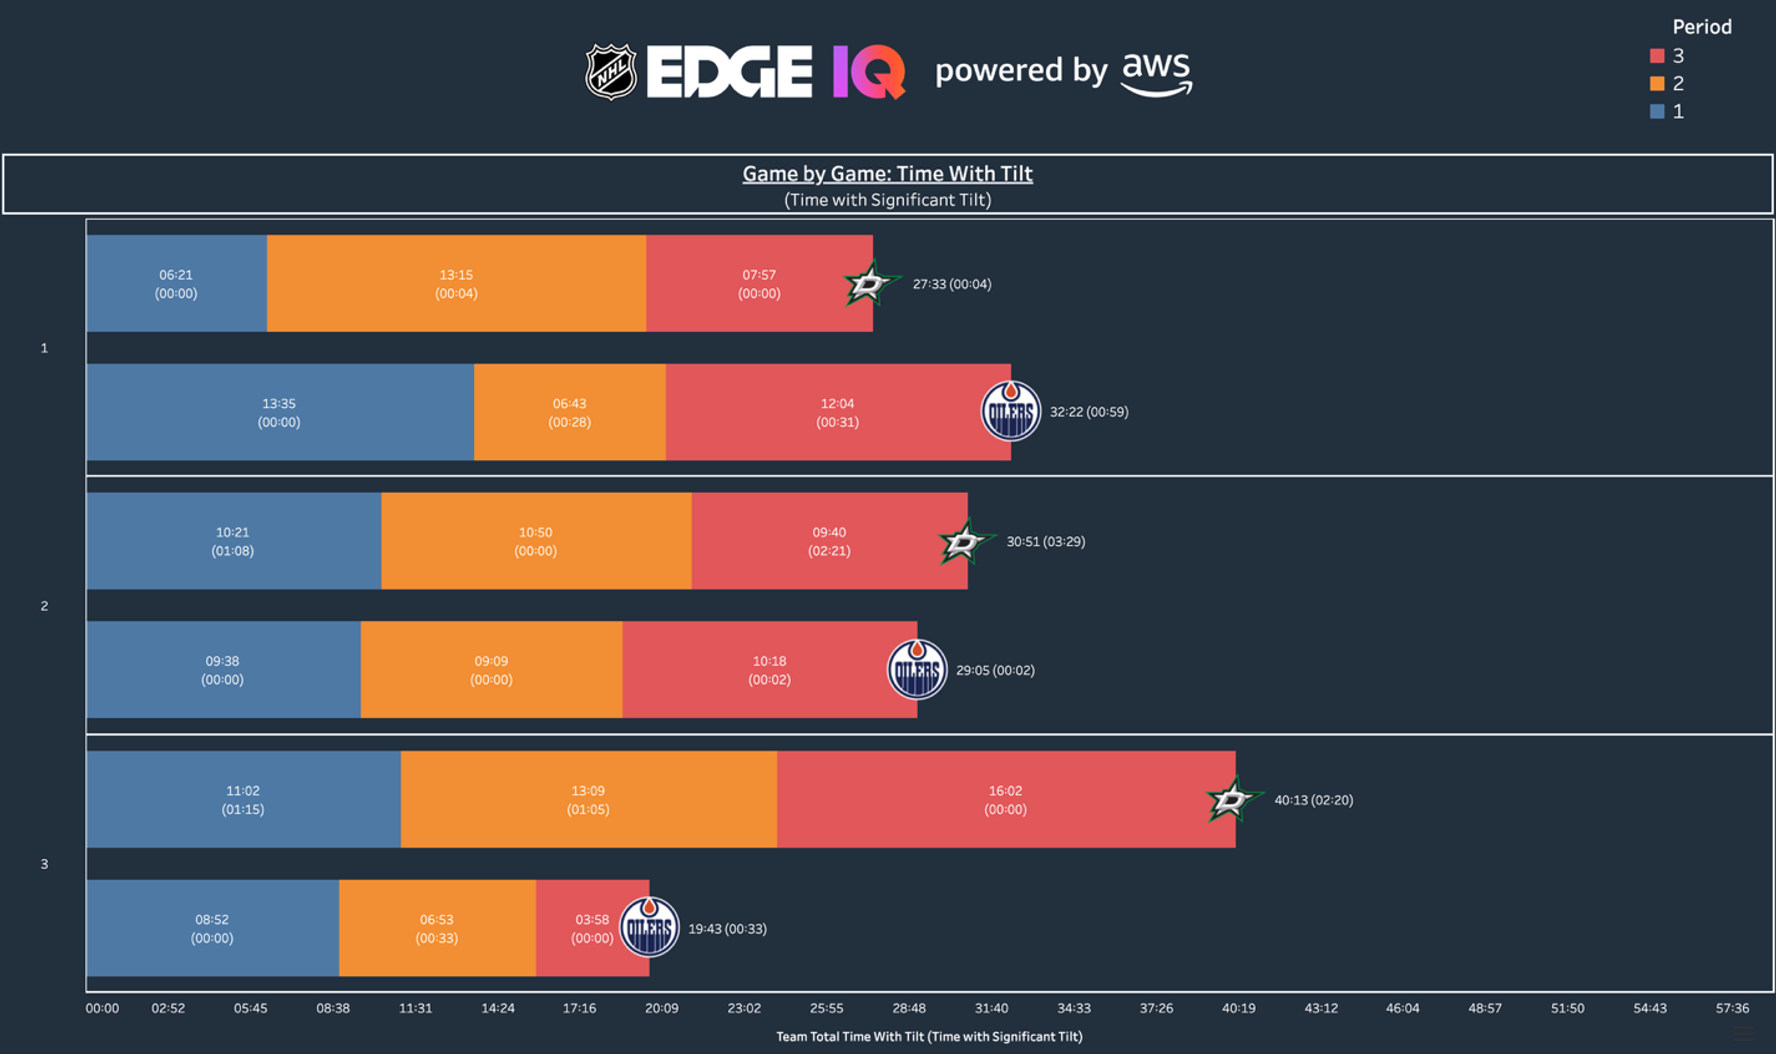
However, as the series has progressed, Edmonton appears to have significantly improved their defensive structure, making it increasingly difficult for the Stars. This is clearly demonstrated by the Ice Tilt pattern observed in the third period of Game 4:
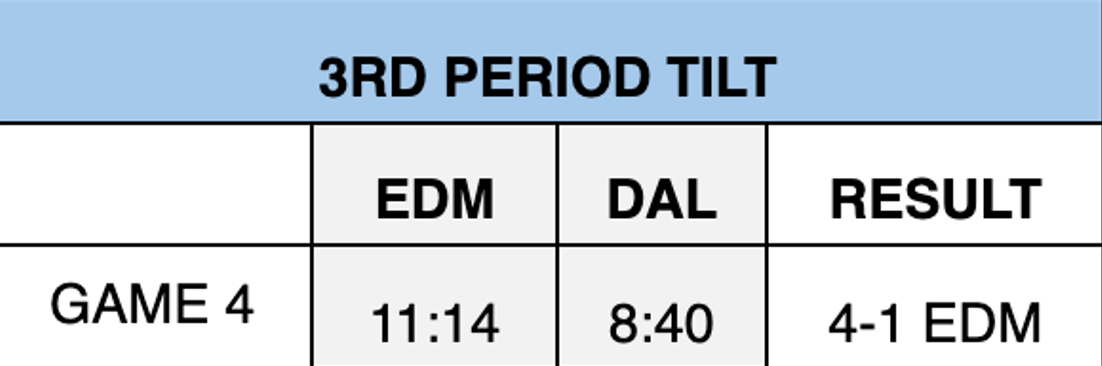
Notably, Game 4 was the first instance in the series where the team that was leading also controlled the Ice Tilt in the final period.
The minute-by-minute “heartbeat” graph further illustrates this dynamic. It shows that during the third period of Game 4, the Stars were unable to consistently pressure in Edmonton`s zone.
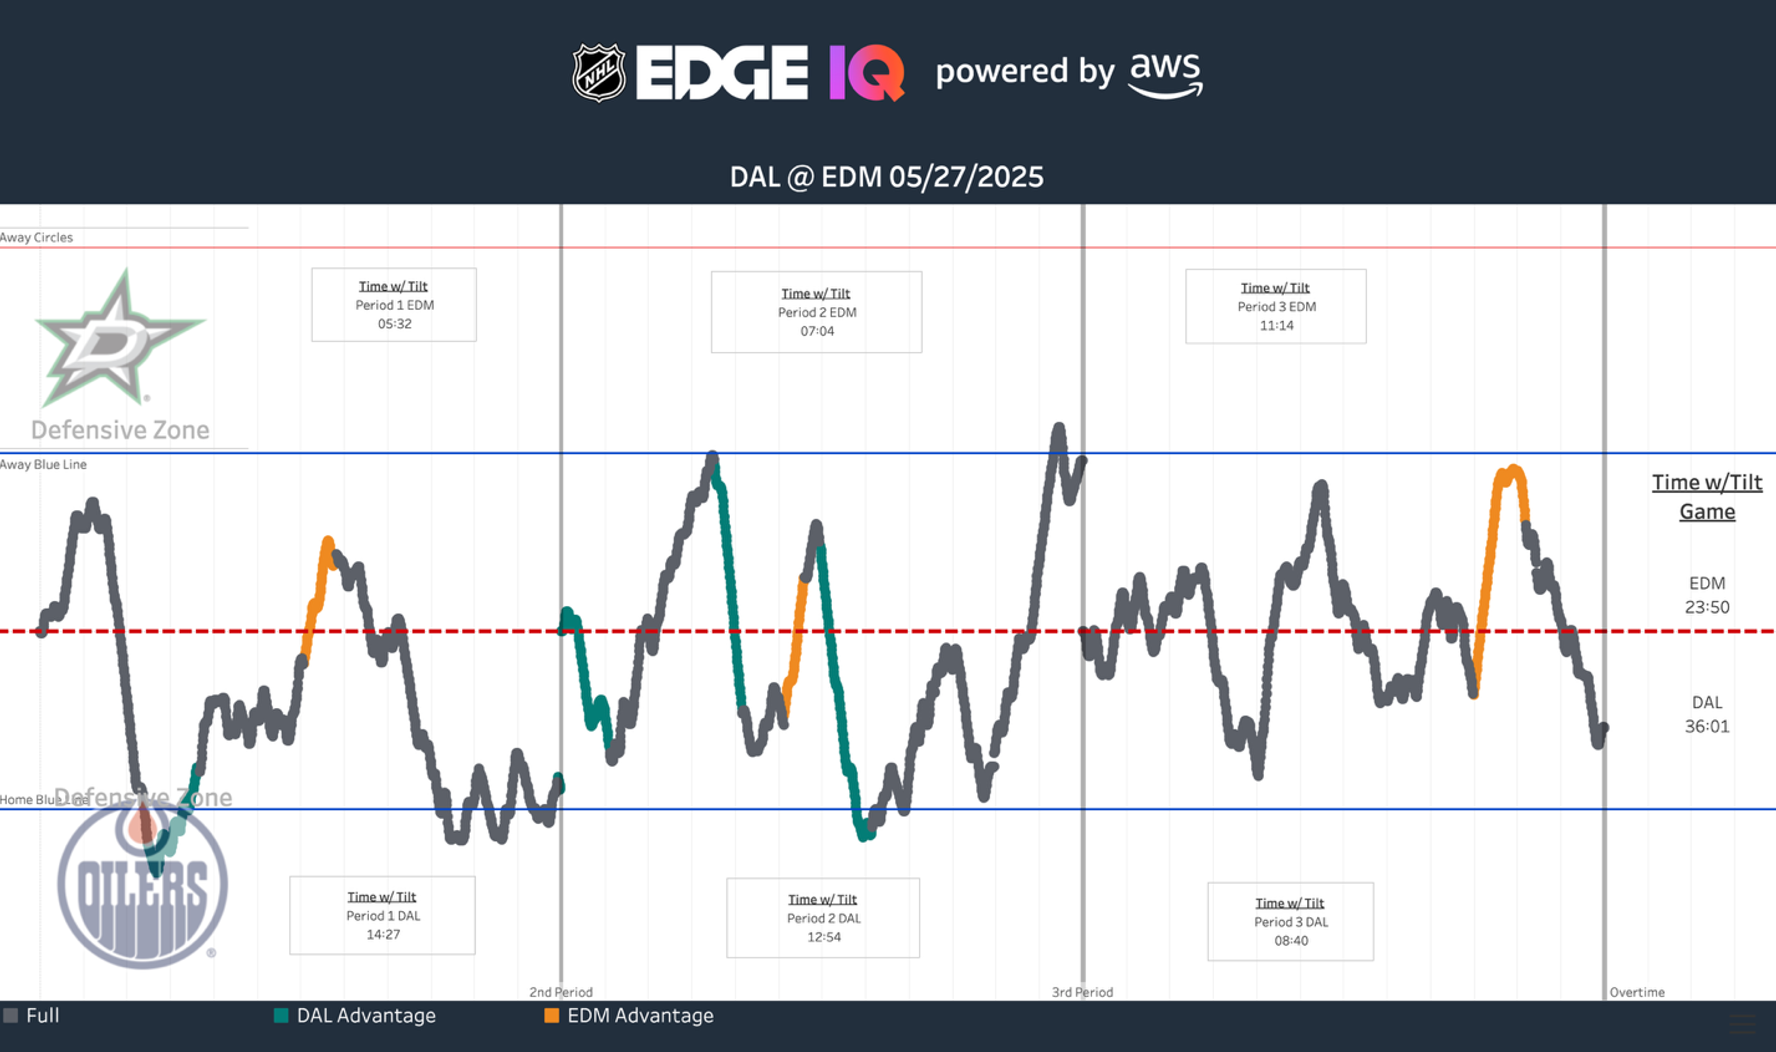
This lack of sustained pressure resulted in the Stars managing only four shots on goal in the third period of Game 4, compared to 13 for the Oilers.
The low shot total for Dallas in Game 4, and generally in the series, highlights Edmonton`s success in disrupting the Stars` shot attempts. Across the series, a significant 59 percent of the Stars` attempted shots have either missed the net or been blocked. (For comparison, the Oilers` rate of missed or blocked attempts is 52 percent in the series).
Data analysis shows that during the regular season, approximately 51.4 percent of shot attempts (taken within 60 feet) either miss the target or are blocked. This percentage increases in the playoffs: 55.5 percent in the first round, and climbing to 57-58 percent in the later rounds. This trend reflects the increasingly tight and desperate defensive play. The Oilers` 59% rate against the Stars demonstrates their exceptional ability in preventing opposing shots from reaching the net.
The Stars` difficulty in getting shots on goal, particularly managing only four in the crucial third period of Game 4 while trailing, highlights a significant challenge for Dallas: they appear unable to solve Edmonton`s defense. Their offensive strategies seem ineffective against the Oilers` structure. Despite finishing third in regular-season scoring and adding a player like Mikko Rantanen late in the season, the Stars have struggled to generate offense when it matters most, scoring only two goals in the last three games. Their failure to even achieve the typical third-period “score effects” push, even when Edmonton was missing key players like Zach Hyman and Mattias Ekholm, is particularly telling.
While it`s possible the Stars could find a way to break down Edmonton`s strong defensive system in Game 5, it currently seems like the Oilers have a definitive advantage. For Dallas to have any hope of a better outcome in the next game, or in the series overall, they must first find a way to control the flow of play more effectively, and subsequently, increase the number of shots that get through to Stuart Skinner.